
Key Performance Indicators For The Agile Skills-First Organization
A Comprehensive Framework for Tracking Adaptability, Innovation, and Organizational Resilience in the Modern Workplace

In an era where change is the only constant, organizations that can rapidly adapt and redeploy their workforce capabilities hold a distinct competitive advantage. As businesses increasingly embrace skills-first talent management approaches, the need for sophisticated measurement systems to track workforce agility has become critical. This article presents a comprehensive framework for measuring workforce agility through key performance indicators for skills-first organizations.
Agility Framework and Measurement Models
Defining Workforce Agility in a Skills-First Context
Workforce agility in skills-first organizations refers to the ability to rapidly identify, deploy, and redeploy talent in response to evolving business needs and changing market conditions. Unlike traditional talent management approaches that focus on roles and hierarchies, skills-first workforce agility emphasizes the dynamic matching of capabilities to opportunities. Research indicates that organizations adopting skills-first approaches can expand their talent pools by up to 10 times, providing unprecedented flexibility in workforce deployment.
Key Definition Metrics:
Capability Coverage Ratio: Percentage of critical skills available across multiple employees and shifts
Skills Demand-Supply Balance: Real-time alignment between emerging skill needs and current workforce capabilities
Cross-Functional Readiness Index: Proportion of employees capable of contributing across different functional areas
Multi-Dimensional Agility Assessment
Effective workforce agility measurement requires evaluation across multiple dimensions simultaneously. The Comprehensive Agility Measurement Tool (CAMT) measures agility on a scale of 1-5, capturing agility through 10 enablers while identifying areas lacking flexibility. Leading organizations implement multi-dimensional assessment frameworks that evaluate strategic responsiveness and organizational flexibility as core components.
Core Assessment Dimensions:
Strategic Agility: Speed of strategic decision-making and implementation
Operational Agility: Efficiency of process adaptation and resource reallocation
Learning Agility: Rate of knowledge acquisition and skill development
Cultural Agility: Organizational adaptability to change initiatives
Technological Agility: Integration speed for new systems and tools
Adaptability vs. Flexibility Metrics
While often used interchangeably, adaptability and flexibility represent distinct organizational capabilities requiring separate measurement approaches. Adaptability measures the organization's ability to change fundamental approaches when circumstances demand it, while flexibility tracks the capacity to adjust within existing frameworks without structural changes.
Adaptability Metrics:
Change Implementation Speed: Time from strategic decision to full deployment
Structural Reconfiguration Rate: Frequency of organizational design modifications
Process Reinvention Index: Percentage of processes fundamentally redesigned annually
Flexibility Metrics:
Resource Reallocation Speed: Time to redeploy assets between projects or departments
Schedule Adjustment Capability: Ability to modify timelines without compromising outcomes
Skill Application Versatility: Range of contexts where individual skills can be applied
Agility Maturity Models and Benchmarking
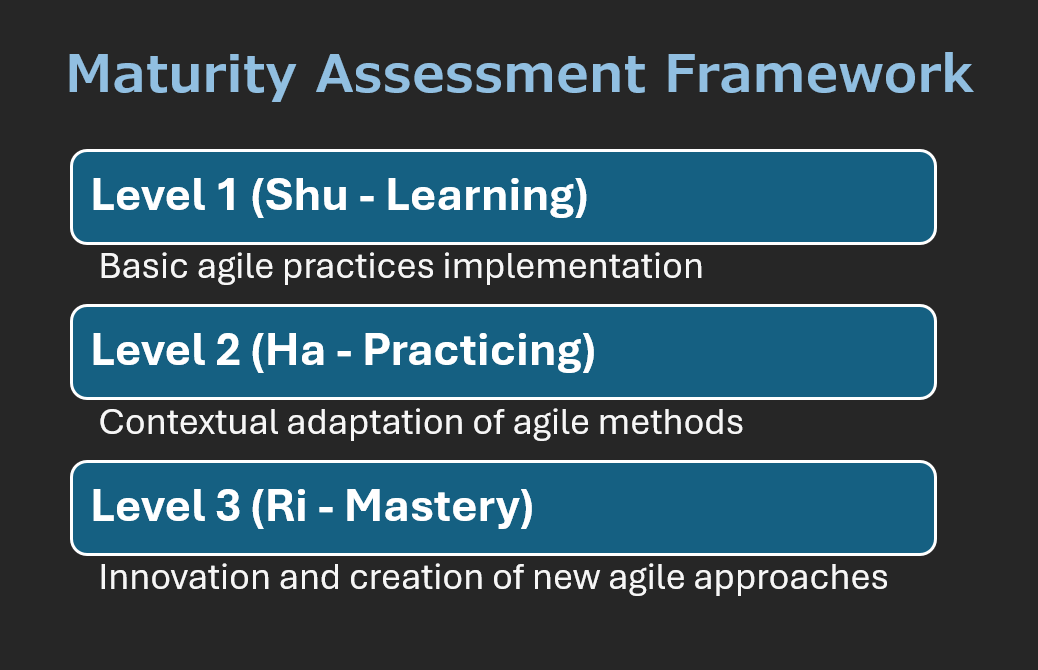
The Organizational Agility Maturity Model (OAMM), developed by Capitol Management Consulting Services, provides a structured framework for measuring the progression of agility across different organizational stages. Based on the Japanese martial art concept of shuhari (learning stages from beginner to master), organizations can assess their agility maturity across 12 criteria, with scores ranging from 0 to 36 points. Modern agility assessment tools, such as SAFe's Team and Technical Agility framework, offer comprehensive evaluation methodologies that align with business objectives.
Skills Mobility and Deployment Metrics
Cross-Functional Skills Utilization Rates
Cross-functional skills utilization measures how effectively organizations leverage diverse capabilities across traditional departmental boundaries. Research shows that employees now participate in twice as many collaborative teams as five years ago, making cross-functional measurement essential. Organizations tracking cross-functional collaboration effectiveness through structured metrics experience significantly improved innovation rates and problem-solving capabilities.
Utilization Metrics:
Cross-Department Project Participation: Percentage of employees contributing to multi-departmental initiatives
Skills Diversity Index: Range of different skill sets applied per project or team
Collaboration Frequency Score: Rate of inter-departmental knowledge sharing and joint problem-solving
Internal Mobility and Skills Transfer Success
Internal mobility metrics assess how effectively organizations move talent to optimize skills deployment and career development. Companies with robust internal talent marketplaces report significantly higher revenue per employee and higher engagement rates. Key indicators include internal promotion rates, skills transfer effectiveness, and succession planning success.
Internal Mobility KPIs:
Internal Fill Rate: Percentage of open positions filled by existing employees
Skills Transfer Success Rate: Effectiveness of knowledge transfer during role transitions
Career Path Velocity: Average time for employees to advance along defined development trajectories
Cross-Functional Movement Rate: Frequency of lateral moves between different organizational areas
Project Assignment Optimization Metrics
Effective project assignment optimization ensures the right skills are matched to the right opportunities at the right time. Advanced workforce performance management systems track skills-project alignment, assignment success rates, and resource utilization efficiency. Organizations implementing skills-first project assignment report improved project outcomes and higher employee satisfaction.
Assignment Optimization Indicators:
Skills-Project Match Accuracy: Percentage of project assignments achieving optimal skills alignment
Assignment Change Rate: Frequency of mid-project resource reallocation
Project Success Correlation: Relationship between optimal skills assignment and project outcomes
Resource Utilization Efficiency: Percentage of employee capacity effectively deployed
Skills-Role Alignment Effectiveness
Skills-role alignment measures how well individual capabilities match current position requirements and responsibilities. Talent blueprint mapping provides a comprehensive visualization of the skills landscape, enabling dynamic assessment of workforce capability. Organizations with strong skills-role alignment report reduced turnover and increased employee engagement.
Alignment Measurement Framework:
Skills Gap Index: Difference between required and available skills per role
Overqualification Rate: Percentage of employees with capabilities exceeding role requirements
Skills Application Rate: Extent to which available skills are actively utilized
Role Evolution Velocity: Speed at which role requirements adapt to incorporate emerging skills
Resource Reallocation Speed and Efficiency
Resource reallocation metrics track how quickly and effectively organizations can redeploy talent in response to changing priorities. Workforce agility practices emphasize the rapid movement of resources while maintaining operational effectiveness. Leading organizations achieve significant competitive advantages through superior reallocation capabilities.
Reallocation Performance Metrics:
Deployment Velocity: Time from reallocation decision to full implementation
Transition Productivity Maintenance: Percentage of productivity retained during resource moves
Reallocation Success Rate: Effectiveness of resource moves in achieving intended outcomes
Cost of Reallocation: Financial and operational costs associated with resource movement
Change Readiness and Response Indicators
Organizational Change Adaptation Speed
Change adaptation speed measures how quickly organizations can implement and integrate new processes, technologies, or strategic directions. Research indicates that high-resilience individuals are 81% more likely to have clear goals during change processes, directly impacting organizational adaptation rates. Change readiness assessments provide foundational metrics for measuring adaptation capabilities.
Adaptation Speed Metrics:
Change Implementation Velocity: Time from change announcement to full adoption
Adaptation Learning Curve: Speed at which employees achieve competency with new approaches
Change Success Rate: Percentage of change initiatives achieving intended outcomes
Resistance Mitigation Effectiveness: Speed of addressing and resolving change resistance
Skills Obsolescence and Renewal Rates
Skills obsolescence tracking has become essential as technological advancement accelerates. Organizations with robust skills obsolescence tracking systems experience higher productivity and lower training costs. Systematic monitoring of skill currency ensures workforce capabilities remain aligned with evolving business requirements.
Obsolescence and Renewal Indicators:
Skills Obsolescence Rate: Percentage of workforce skills becoming outdated annually
Skill Renewal Velocity: Speed at which new capabilities replace obsolete ones
Technology Relevance Index: Alignment between employee skills and current technology requirements
Future Skills Preparation Rate: Percentage of workforce developing anticipated future capabilities
Technology Adoption and Integration Metrics
Technology adoption metrics assess how effectively organizations integrate new tools and systems while maintaining operational continuity. Successful technology integration requires both technical implementation and human adoption, making measurement a complex yet essential process. Organizations that excel in technology adoption demonstrate superior market responsiveness.
Technology Integration KPIs:
Adoption Rate Velocity: Speed at which employees achieve proficiency with new technologies
Integration Effectiveness Score: Seamlessness of new technology incorporation into existing workflows
Technology ROI Realization Time: Duration from implementation to measurable business value
User Acceptance Index: Employee satisfaction and engagement with new technological tools
Market Disruption Response Capabilities
Market disruption response measures organizational capacity to adapt to external shocks and competitive threats. Research from McKinsey shows that agile organizations demonstrate superior performance during market volatility due to their enhanced responsiveness capabilities. Disruption response measurement helps organizations build resilience against unexpected market changes.
Disruption Response Metrics:
Response Time to Market Changes: Speed of strategic and operational adjustments to market shifts
Competitive Threat Mitigation Rate: Effectiveness in addressing competitive challenges
Market Opportunity Capture Speed: Ability to quickly capitalize on emerging market opportunities
Recovery Velocity: Speed of returning to optimal performance after disruption events
Team and Collective Agility Measures
Cross-Team Collaboration Effectiveness
Cross-team collaboration effectiveness measures how well different organizational groups work together toward shared objectives. Effective cross-functional collaboration requires clear metrics tracking communication quality, joint problem-solving success, and shared outcome achievement. Organizations with superior collaboration effectiveness report significantly higher innovation rates and faster project completion times.
Collaboration Effectiveness Indicators:
Inter-Team Communication Frequency: Rate and quality of cross-team information sharing
Joint Problem Resolution Success: Percentage of challenges resolved through collaborative efforts
Shared Objective Achievement Rate: Success in meeting cross-team goals and deliverables
Collaboration Satisfaction Index: Team member satisfaction with cross-functional working relationships
Knowledge Sharing and Transfer Rates
Knowledge sharing metrics evaluate how effectively organizations disseminate and retain critical information across teams and individuals. Research indicates that structured knowledge management approaches can boost employee productivity by 25%. Measuring the effectiveness of knowledge sharing provides insights into an organization's learning capacity and information flow efficiency.
Knowledge Sharing KPIs:
Knowledge Creation Rate: Volume and quality of new knowledge generated
Knowledge Utilization Frequency: Rate at which shared knowledge is accessed and applied
Transfer Effectiveness Score: Success rate of knowledge transfer between individuals and teams
Knowledge Retention Index: Percentage of critical knowledge preserved during personnel changes
Collective Problem-Solving Capabilities
Collective problem-solving measures team and organizational capacity to address complex challenges through collaborative efforts. Effective problem-solving assessment requires tracking solution quality, implementation speed, and stakeholder satisfaction to ensure optimal outcomes. Organizations with strong collective problem-solving capabilities demonstrate superior adaptability and innovation performance.
Problem-Solving Assessment Framework:
Problem Resolution Speed: Time from problem identification to effective solution implementation
Solution Innovation Rate: Percentage of novel approaches developed for complex challenges
Stakeholder Satisfaction with Solutions: Quality and acceptability of collaborative problem-solving outcomes
Learning from Problem-Solving: Knowledge gained and applied from collaborative challenge resolution
Team Reconfiguration Success Metrics
Team reconfiguration metrics track organizational ability to form, reform, and optimize team structures in response to changing needs. Research on team reconfiguration shows that autonomous teams with clear decision-making authority demonstrate superior performance outcomes. Successful reconfiguration requires striking a balance between stability and adaptability.
Reconfiguration Success Indicators:
Team Formation Speed: Time required to establish effective new team configurations
Reconfiguration Success Rate: Percentage of team restructures achieving intended improvements
Team Stability During Change: Maintenance of team effectiveness during restructuring processes
Configuration Optimization Frequency: Rate at which team structures are refined for improved performance
Innovation and Experimentation Rates
Innovation and experimentation metrics measure organizational capacity for creative problem-solving and continuous improvement. Psychological safety plays a crucial role, as teams demonstrate higher innovation rates when members feel comfortable taking risks and sharing their ideas. Organizations that foster innovation through structured experimentation exhibit superior long-term performance.
Innovation Measurement Framework:
Innovation Implementation Rate: Percentage of experimental approaches adopted for regular use
Experimentation Frequency: Number of new approaches tested per team or organizational unit
Creative Solution Generation: Volume and quality of novel ideas produced by teams
Risk-Taking Comfort Level: Employee willingness to propose and test unconventional approaches
Real-Time Agility Monitoring
Continuous Skills Demand Sensing
Continuous skills demand sensing provides real-time visibility into evolving capability requirements across the organization. Early warning systems help organizations identify emerging skill gaps before they impact operational performance.
Demand Sensing Metrics:
Emerging Skills Identification Rate: Speed of recognizing new capability requirements
Demand Forecasting Accuracy: Precision of predicting future skills needs
Market Skills Trend Alignment: Correlation between internal demand sensing and external market trends
Proactive Skills Development Rate: Percentage of emerging needs addressed through advanced preparation
Dynamic Workforce Planning Metrics
Dynamic workforce planning enables organizations to adapt their talent strategies in real-time based on changing business conditions. Predictive workforce planning serves as an early warning system, enabling organizations to identify potential skill shortages and succession gaps before they become critical. Effective dynamic planning integrates multiple data sources for comprehensive workforce visibility.
Dynamic Planning KPIs:
Resource Optimization Index: Efficiency of talent allocation across organizational priorities
Strategic Alignment Score: Degree to which workforce planning supports business objectives
Forecast Accuracy Rate: Precision of workforce demand and supply predictions
Planning Cycle Agility: Speed of workforce plan adjustments in response to changing conditions
Agility Dashboard Development
Agility dashboards provide real-time visibility into workforce flexibility and responsiveness metrics. Modern HR dashboard examples demonstrate the importance of visualizing complex workforce data for executive decision-making. Effective dashboards integrate multiple data sources while maintaining user-friendly interfaces for different stakeholder groups.
Dashboard Effectiveness Measures:
Decision Support Effectiveness: Quality of insights generated for workforce management decisions
Real-Time Data Accuracy: Reliability and currency of dashboard information
User Engagement Metrics: Frequency and depth of dashboard utilization across organizational levels
Data Integration Completeness: Percentage of relevant workforce data sources incorporated
Early Warning Systems for Skills Gaps
Early warning systems for skills gaps provide advance notice of emerging capability shortfalls before they impact organizational performance. Research indicates that 87% of companies are aware they either already have skills gaps or will have them within a few years. Predictive systems help organizations transition from a reactive to a proactive approach to skills management.
Early Warning System Metrics:
Gap Prediction Accuracy: Precision of skills gap forecasts and timing
Warning Lead Time: Advance notice provided before skills shortages impact operations
Prevention Success Rate: Percentage of predicted gaps successfully prevented through proactive measures
System Sensitivity: Ability to detect subtle signals indicating emerging skills challenges
Leadership and Cultural Agility Indicators
Management Agility Assessment
Management agility assessment measures leadership capability to navigate complex, rapidly changing business environments. Research from McKinsey identifies management agility as critical for organizational success, with agile leaders demonstrating superior decision-making speed and adaptability. Leadership assessment frameworks evaluate both individual and collective management effectiveness in agile contexts.
Management Agility KPIs:
Change Leadership Effectiveness: Success rate in guiding the organization through transformation initiatives
Decision Speed Index: Time required for management decision-making processes
Strategic Pivot Capability: Leadership ability to change direction when circumstances require
Empowerment Delegation Rate: The Extent to which management enables autonomous team decision-making
Cultural Transformation Metrics
Cultural transformation metrics track organizational progress toward agility-supporting values and behaviors. Successful agile transformations demonstrate impact across multiple dimensions, with cultural change serving as a foundation for sustained agility. Culture transformation measurement requires both quantitative indicators and qualitative assessment approaches.
Cultural Transformation Indicators:
Value Adoption Rate: Percentage of employees demonstrating agile values in daily work
Behavioral Change Frequency: Rate at which new agile behaviors replace traditional approaches
Cultural Resistance Index: Level of resistance to agility-focused cultural changes
Cultural Maturity Score: Overall organizational progress toward agile culture integration
Employee Engagement in Change Initiatives
Employee engagement in change initiatives measures workforce participation and commitment to organizational transformation efforts. Research shows that employees who feel well-supported by managers are 44% more likely to view organizational change positively. Change engagement metrics provide insights into transformation sustainability and potential for success.
Change Engagement Metrics:
Participation Rate in Change Activities: Percentage of employees actively engaging in transformation initiatives
Change Advocacy Index: Degree to which employees champion change efforts to colleagues
Feedback Quality and Frequency: Level of constructive input provided during change processes
Change Satisfaction Score: Employee satisfaction with change implementation approaches
Learning Culture Maturity Indicators
Learning culture maturity measures organizational commitment to continuous capability development and knowledge sharing. Organizations with strong learning cultures demonstrate superior adaptability and innovation. Learning culture assessment includes evaluating both formal and informal learning mechanisms.
Learning Culture KPIs:
Learning Initiative Participation Rate: Percentage of employees engaging in development opportunities
Knowledge Sharing Frequency: Rate of information and expertise exchange across the organization
Skill Development Investment: Resources dedicated to employee capability enhancement
Learning Outcome Application Rate: Percentage of learned capabilities applied in work contexts
Psychological Safety and Risk-Taking Measures
Psychological safety measurement assesses the degree to which team members feel comfortable taking risks, expressing ideas, and admitting mistakes without fear of negative consequences. Google's Project Aristotle research demonstrated that psychological safety is the most critical factor in team effectiveness. Teams with high psychological safety show three times better performance than those without.
Psychological Safety Metrics:
Risk-Taking Comfort Level: Employee willingness to propose innovative or unconventional approaches
Error Reporting Rate: Frequency of openly reporting mistakes for learning purposes
Idea Generation Volume: Number of new concepts and suggestions provided by team members
Feedback Exchange Quality: Effectiveness and frequency of constructive feedback between colleagues
Technology-Enabled Agility Measurement
Modern workforce agility measurement increasingly relies on sophisticated technology platforms. Talent marketplaces utilize AI-powered matching to connect employee capabilities with organizational opportunities, leading to enhanced internal mobility and improved skill utilization. Advanced analytics platforms provide real-time visibility into workforce capabilities and emerging skill gaps.
Organizations implementing comprehensive skills tracking technology report significant improvements in workforce deployment efficiency and employee satisfaction. The integration of learning management systems with skills assessment tools enables automatic competency updates as employees complete their development programs.
Measurement Integration and Continuous Improvement
Successful workforce agility measurement requires integration across multiple organizational systems and processes. Leading organizations implement comprehensive measurement frameworks that align individual, team, and organizational metrics with strategic business objectives. Regular assessment cycles enable continuous refinement of agility indicators and improvement approaches.
The most effective implementations balance quantitative metrics with qualitative assessment methods, ensuring a comprehensive understanding of an organization's agility capabilities. Continuous feedback loops enable real-time adjustment of measurement approaches based on changing business needs and external conditions.
Implementation Case Studies and Best Practices
Successful Workforce Agility Transformations
Leading organizations demonstrate measurable success through comprehensive workforce agility implementations. ING Bank's agile transformation resulted in improved efficiency, faster time-to-market, and significantly higher employee engagement scores. The telecommunications company Spark New Zealand achieved market-leading customer Net Promoter Scores and sector-leading returns through comprehensive agility measurement and implementation.
AT&T's Workforce2020 program, designed to upskill and reskill 250,000 employees, was developed following a comprehensive skills gap audit that identified opportunities to develop internal talent rather than relying solely on recruiting skilled employees. The program included comprehensive skills mapping, career intelligence tools accessed over six million times annually, and partnerships with educational institutions for capability development.
Conclusion: Building Agile Organizations Through Strategic Measurement
The measurement of workforce agility represents a critical capability for organizations navigating today's dynamic business environment. Through comprehensive assessment of skills mobility, change readiness, team collaboration, real-time monitoring, and cultural transformation, organizations can build sustainable competitive advantages based on human capital flexibility and responsiveness.
The frameworks and metrics presented in this article provide human resource managers with concrete tools for measuring and improving workforce agility in skills-first organizations. By implementing structured measurement approaches across the six key domains—agility frameworks, skills mobility, change readiness, team effectiveness, real-time monitoring, and leadership culture—organizations can transform their workforce capabilities from static resources into dynamic competitive advantages.
Research consistently demonstrates that organizations investing in workforce agility measurement and development achieve superior business outcomes, including higher profitability, increased income per employee through structured learning, and significantly improved employee engagement and retention rates. These compelling statistics underscore the business case for comprehensive measurement of workforce agility.
The future belongs to organizations that can rapidly identify, develop, and deploy human capabilities in response to evolving challenges and opportunities. By implementing robust measurement systems for workforce agility, organizations position themselves not merely to survive change but to thrive through it. The frameworks, metrics, and implementation approaches outlined in this article provide the foundation for building truly agile, skills-first organizations capable of sustained success in an uncertain world.
Human resource leaders who embrace comprehensive workforce agility measurement will find themselves equipped with powerful tools for driving organizational transformation, improving employee experiences, and delivering measurable business value. The journey toward workforce agility begins with measurement—and the organizations that start today will be the leaders of tomorrow.
Notes
https://nestorup.com/blog/skills-first-a-new-framework-for-talent-management/
https://scholarworks.waldenu.edu/cgi/viewcontent.cgi?article=1046&context=ijamt
https://www.infoq.com/articles/agile-team-maturity-assessment/
https://capitolmcs.com/wp-content/uploads/2019/05/CMCS_Agile-Maturity-Model-1.pdf
https://scaledagile.com/blog/measuring-team-and-technical-agility-guide/
https://devskiller.com/blog/internal-mobility-success/
https://sprad.io/guides/talent-marketplace
https://fuel50.com/2025/01/what-is-a-skills-gap/
https://mau.com/workforce-agility-simplified-less-chaos-more-results/
https://dynamics.folio3.com/blog/change-management-kpis/
https://www.aihr.com/blog/change-management-metrics/
https://www.myshyft.com/blog/skills-obsolescence-management/
https://www.myshyft.com/blog/skill-obsolescence-tracking/
https://agility-at-scale.com/safe/teams/
https://www.sciencedirect.com/science/article/pii/S0040162524000027
https://usccg.com/blog/measure-effectiveness-cross-functional-collaboration/
https://www.ppm.express/blog/cross-functional-team-productivity
https://www.numberanalytics.com/blog/ultimate-guide-knowledge-sharing-metrics-software-metrics
https://blog.procedureflow.com/knowledge-management/knowledge-management-metrics
https://www.linkedin.com/advice/3/how-can-you-effectively-measure-cross-functional-038oc
https://aisel.aisnet.org/misq/vol45/iss4/24/
https://agilevelocity.com/blog/psychological-safety-in-agile-teams/
https://www.agilebydesign.com/blog/organizational-agility
https://www.hibob.com/blog/measuring-workforce-planning/
https://www.qlik.com/us/dashboard-examples/hr-dashboard
https://technologyadvice.com/blog/human-resources/hr-dashboard-examples/
https://www.xeomatrix.com/blog/5-hr-analytics-dashboard-examples-for-reporting-kpis/
https://www.instride.com/insights/skills-gap-statistics/
https://www.ibisworld.com/blog/early-warning-workforce/
https://www.zendesk.com/blog/measuring-change-management-success/
https://www.agilesherpas.com/blog/business-agility-examples-case-studies
https://workmatters.ie/wp-content/uploads/2022/12/Case-Studies-in-Agility.pdf
https://www.prosci.com/blog/metrics-for-measuring-change-management
https://blog.smart-tribune.com/en/knowledge-management-metrics
https://www.leaderfactor.com/learn/measuring-psychological-safety
https://www.valuex2.com/5-inspiring-case-studies-of-successful-agile-transformations/
https://eightfold.ai/blog/talent-marketplace-explained/
https://www.phenom.com/blog/what-is-talent-marketplace
https://agilemania.com/agile-metrics-and-kpi-you-must-track
https://nextsource.com/blog/which-kpis-should-you-track-for-your-contingent-workforce-program/
https://www.pluralsight.com/resources/blog/business-and-leadership/skills-talent-management-strategy
https://agilemania.com/tutorial/how-to-measure-business-agility
https://hubstaff.com/blog/workforce-management-metrics/
https://velocityglobal.com/resources/blog/hr-kpis/
https://www.sciencedirect.com/science/article/pii/S0090261625000178
https://www.agilesherpas.com/blog/how-to-measure-business-agility